Touring the Universe
With Scientific Python
@brandon_rhodes
CodeMash 2013
The iPython Notebooks
that go with this talk:
They will continue evolving,
but you can always rewind to today!
git checkout 'master@{2013-01-11 12:00:00}'
Goal?
a modest introduction
Goal
To talk about astronomy
while
introducing a simple
scientific Python
tool stack
The Stack
- iPython Notebook
- matplotlib or mayavi
- SciPy
- NumPy
- Python 2.7
An iPython Notebook consists
of cells of code (or titles or text)
that you run with Shift + Enter
Notebook:
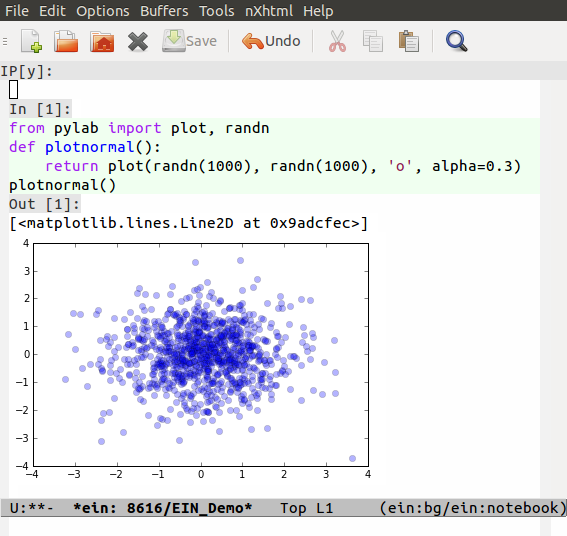
“The Inspiration”
Takeaways
- Array-agnostic functions are an art
- Vectors properly take singular names(much like relations in SQL!)
- Use print and assert aslightweight in-notebook tests
Syntax quick reference—
Remember Dijkstra!
“0 ≤ i < N
…
“let us let our ordinals start at zero:
an element's ordinal (subscript)
equals the number of elements
preceding it in the sequence.”
— ED831
First element
a[0]
Fourth element
a[3]
Next-to-last element
a[-2]
Last element
a[-1]
Or, for those who took Latin—
Ultimate element
a[-1]
Penultimate element
a[-2]
Antepenultimate element
a[-3]
Slicing
Again, remember Dijkstra:
0 ≤ i < N
As well as C-style languages:
for (i = 0; i < N; i++) ;
Slicing
Elements 3, 4, and 5
a[3:6]
Slicing
First three elements 0, 1, and 2
a[:3]
Slicing
All but first element
a[1:]
Slicing
Last three elements
a[-3:]
Slicing
New copy of entire list
a[:]
So that is how built-in Python
lists and tuples are indexed
NumPy Arrays
Generalize Python lists
to n dimensions
NumPy Arrays
Use compact binary instead
of storing each item as an object
[1, 2, 3] — four objects
np.array([1, 2, 3]) — one object!
NumPy Arrays
Index and slice work as expected,
with comma separating dimensions
NumPy Arrays
a = np.array([[1, 2, 3, 4],
              [5, 6, 7, 8],
              [9, 10, 11, 12]])

print a[:-1,1:3]
produces
[[2 3]
 [6 7]]
NumPy Arrays
Support both element-wise
and aggregate operators
a = np.array([1, 2, 3])

print a + 10   # => [11 12 13]
print a + a    # => [2 4 6]
print a.sum()  # => 6
Enough
Let's look at a
larger data set
Notebook:
“Asteroids”
Was that crazy, or what?
theta[r > 4.5]
My first reaction: “Crazy!”
theta[r > 4.5]
How does that work?
My first hypothesis:
They cheated
theta[r > 4.5]
“Obviously, applying > to an
array returns a magic object that
remembers the comparison, and
x[…] knows how to apply it.”
I was wrong
I was wrong
and
NumPy is really beautiful!
The behavior of > is
completely symmetric with how
arrays treat other operators!
theta = np.array([ 0.0, 1.6, 3.1, 4.7 ])
r = np.array([ 0.0, 1.0, 2.0, 3.0 ])

r + 1.5         # => [ 1.5  2.5  3.5  4.5]
theta = np.array([ 0.0, 1.6, 3.1, 4.7 ])
r = np.array([ 0.0, 1.0, 2.0, 3.0 ])

r + 1.5         # => [ 1.5  2.5  3.5  4.5]
r > 1.5         # => [False False  True  True]
theta = np.array([ 0.0, 1.6, 3.1, 4.7 ])
r = np.array([ 0.0, 1.0, 2.0, 3.0 ])

r + 1.5         # => [ 1.5  2.5  3.5  4.5]
r > 1.5         # => [False False  True  True]
theta[r > 1.5]  # => [ 3.1  4.7]
theta = np.array([ 0.0, 1.6, 3.1, 4.7 ])
r = np.array([ 0.0, 1.0, 2.0, 3.0 ])

r + 1.5         # => [ 1.5  2.5  3.5  4.5]
r > 1.5         # => [False False  True  True]
theta[r > 1.5]  # => [ 3.1  4.7]
The secret: you can index into
an array with a subscript that
is another array of booleans!
theta[r > 4.5]
Zen of Python:
“Special cases aren't special
enough to break the rules”
theta[r > 4.5]
The best Python API tricks occur when
orthogonal, separately useful behaviors
can be combined in interesting ways
A quick reflection on
the science behind this talk
A Caveat
This talk does not
describe how real
astronomers work!
Observational Astronomy Workflow
Model
↓
Point telescope
↓
Images and Data
↓
Process and Hypothesize
↓
Model
The Important Step
Model
↓
Point telescope
↓
Images and Data
↓
Process and Hypothesize
↓
Model
Real astronomers:
hard work to interpret
raw data and images
Amateurs like me:
run models,
draw pictures!
Take-away
Those were not real asteroid
positions that we just plotted
Take-away
Those were imperfect predictions
based on models that keep improving
Models Used So Far
Planet positions: VSOP87, DE405
Asteroid positions: Kepler
Our Next Example
Model:
SGP4
↓
Predictions:
Satellite positions
↓
Visualization:
3D globe with satellites
Notebook:
“3D Earth Satellites”
We can apply the same
3D tools to the whole
solar system
Notebook:
“3D Solar System”
Take-away
Scale varies wildly
as you ascend from atom
to planet to star system
It is usually cleanest
to build a separate 3D
visualization specific to each scale
Low Earth orbit
Earth-Moon
Solar System
⋮
A sky chart combining solar system
bodies with distant stars can simply
“mix down” each object into an x,y
coordinate and plot them in 2D
Other Directions
There are many ways to
pack a diagram with information
Glyphs can vary in—
Position
Opacity
Color
Size
Notebook:
“Stars”
Our visualizations
so far have emphasized
physical space
Diagrams can also
relate non-spatial data
sets to each other
Notebook:
“Hertzsprung-Russell”
While NumPy provides
efficient vector arrays,
the SciPy library provides
numeric processing
SciPy
- Statistics
- Optimization
- Numerical integration
- BLAS/LINPACK (linear algebra)
- Fourier transforms
- Signal processing
- Image processing
- ODE solvers
- Special functions
Notebook:
“Stellar-Color-Index”
Notebook Superpowers
File » Download As
When viewing a Notebook
through someone else's server,
you can download it to your
own hard drive and run it
Drag and drop
Drag .py and .ipynb
files into the iPython Dashboard,
and a local copy of the code
is created for you to edit
Notebook:
“iPython Features”
R Magic
Jonathan Taylor of Stanford's
extension for cells that contain
R-language statistics code
%%R -i X,Y -o XYcoef
XYlm = lm(Y~X)
XYcoef = coef(XYlm)
print(summary(XYlm))
par(mfrow=c(2,2))
plot(XYlm)
Additional Languages
Native — Bash, Cython, Octave, Perl, R, Ruby
3rd party — Matlab, Mathematica
Publishing
Thanks to HTML export,
iPython can be used to write
blog posts or even entire books
that can be re-executed to verify
their code and diagrams
nbviewer.ipython.org
An online in-the-cloud
iPython Notebook interpreter
iPython “parallel” module
Can distribute computations
across either a dedicated or
an in-the-cloud cluster
Compatible with MIT's
StarCluster for EC2
Visual Studio 2010
Python Plugin includes
an iPython client
and
Takafumi Arakaki has written
an Emacs client for iPython Notebook
Internals: Communication
Front-ends use a simple,
well-documented protocol over ØMQ
to communicate with Notebook server
Internals: Notebook Format
JSON that is designed to support
both machine and hand-editing
{
 "cell_type": "code",
 "collapsed": false,
 "input": [
  "from mayavi import mlab\n",
 ],
 "language": "python",
 "metadata": {},
 "outputs": []
},
Internals: Notebook Format
The frequent and predictable newlines
make it version-control friendly!
{
 "cell_type": "code",
 "collapsed": false,
 "input": [
  "from mayavi import mlab\n",
 ],
 "language": "python",
 "metadata": {},
 "outputs": []
},
Internals: Notebook Format
Unless you Cell » All Output » Clear
before saving, inline images and media
get saved as base64 strings—
Internals: Notebook Format
—this means that an iPython Notebook
can survive uploading or emailing
with all of its images intact!
Impact
“Computing is the backbone
of all of science”
— Fernando Perez
Big take-away
Because the language runtime
builds state behind iPython Notebook,
it supports rapid iteration as you
work on a particular step in your
processing or visualization
Why Python?
Clean
Elegant
Natural notation
3*x + 1
f(x)
Performance
Large array operations
are performed in C or FORTRAN,
amortizing away dynamic language costs
John D. Hunter (1968–2012)

2002–2012 — Create, maintain Matplotlib
18 July 2012 — SciPy 2012 keynote speaker
28 August 2012 — Died from cancer
I am @brandon_rhodes
Thank you!